Where grow food? A suitability analysis of where to establish a new bio-intensive farm plot in Southeast Virginia
Section I: Introduction
As nations around
the world become more urbanized, and as space suitable for agriculture amounts
to a premium, people living in urban
areas will need to seek alternative methods to acquire fresh produce. A lack of ready access to fresh produce has
both environmental and human health consequences. A study by Pearce, et.al. (2007) revealed a
strong indication of “food deserts” in economically deprived urban
neighborhoods in New Zealand. Food
deserts are areas where people have a long travel distance to full-service
grocery stores compared to fast-food restaurants and convenient stores. Their study revealed total distances to
full-service grocery stores were longer than distances to fast-food restaurant
within economically poor urban areas in New Zealand.
There
exists a general lack of understanding of where food comes from, as well. A reliance on large grocery stores with
expensive food coming from great distances has revealed a populous not fully
understanding the agricultural origin for their produce. Leopold (1970) expresses the naïve view
regarding agriculture:
“There are two spiritual dangers in
not owning a farm. Once is the danger of
supposing that breakfast comes from the grocery, and the other that heat comes
from the furnace.”
Clearly the source of
food for meals originates from farms and that the heat from the furnace must
come from a combustible source such as natural gas. As urbanized populations become disconnected
with the process of agricultural production and natural resource extraction,
the misunderstanding of food sources and origins becomes pervasive.
In response to the dominance of corporate agriculture and
the daunting effects it can have on the environment, cities across the United
States have been developing community gardens to provide food to lower-income,
socioeconomically disadvantaged peoples.
Community gardens have been cited for their various benefits, including
the elimination of urban food deserts, addressing nutrition problems, reducing
the cost of fresh food for families, and engaging people in their neighborhoods
to become involved with community development and growth (Grow Pittsburgh,
2013).
Grow
Pittsburgh, an urban agriculture non-government organization in the city of
Pittsburgh, Pennsylvania, has utilized abandoned lots in the post-industrial
landscape of this western Pennsylvania community to grow crops using
biointensive methods of farming. Biointensive farming is a method of agriculture
with a focus on producing a high yield of crops via organic agriculture methods
using only a small amount of space, usually an 8’X 3’ garden plot (Micro Farms,
2013). The modest amount of cultivated
land combined with modern organic farming methods allows for a nearly
continuous output of crops on a yearly basis without compromising space. It also utilizes a chemical-free crop
management practice intended to reduce impacts to natural resources.
This study
examines potential sites to establish a new biointensive farm location in two densely
populated cities in southeast Virginia: Norfolk and Virginia Beach (see Map
1). The Micro Farms, a subsidiary of the
non-for-profit Ecocycling, an organization dedicated to sustainable community
development in this region, has been constructing biointensive farm plots in
various locations. At the time this
paper was written, the Microfarms have 5 biointensive farm plots in the city of
Norfolk, as well as a conglomerate of plots on a farm in Virginia Beach (see
Map 2).
The cities
of Norfolk and Virginia Beach are characterized as a mostly urban landscape,
with socioeconomically disadvantaged people across many areas (see Map 3). Norfolk in particular has a large concentration
of minority people, as indicated by Maps 3-5.
This suitability analysis for a new Micro Farms biointensive farm plot
will take into account racial and socioeconomic factors using a Geographic
Information System (GIS). The criteria
include:
·
A location
within an impoverished neighborhood. The
National Poverty Center (2013) has determined that the poverty rate for a
family of four in the United States is $22,113.
·
A location
where the population is greater than 50% racial minorities. ‘Racial
minorities’ in this context will be defined as any population that is
non-white.
·
Within 2
miles of a public school.
·
Greater
than 2 miles from an already established farm or garden.
Part of the goal of community
gardens and biointensive farm plots is to provide ready access to fresh food to
those who suffer “food insecurity” as a result of a low-income status (Grow
Pittsburgh, 2013). Therefore it would be
ideal to establish a farm location within an economically disadvantaged
neighborhood. An area dominated by
minority populations is also ideal, as environmental justice advocates have
cited a lack of quality environmental health resources in regions dominated by
minorities (Warren, 2003). A location near
public schools could help make the farm plot visible to young people, and could
perhaps help establish community norms about growing food in urban areas. Guidelines regarding the establishment of
community norms in environmental sustainability projects and its rate of
success is outlined by McKenzie-Mohr et al (1999), and is the inspiration for
this particular criteria. Finally, to
further narrow down a new plot location, a site that is a reasonable distance
(2 or more miles) from one of the currently established plots will be included
in the analysis.
Section II:
Methodology
Census
tract data for Norfolk and Virginia Beach were acquired from the U.S. Census
Bureau’s Topologically Integrated Geographic Encoding and Referencing (TIGER)
website, which has census tract data for the 2010 census in a GIS-compatible
format. These GIS data layers include
population information by race. A percentage
of minority (non-white) people was calculated for each census tract in Norfolk
and Virginia Beach based upon 2010 population data. This
newly calculated data field was then imported back into the GIS. The GIS was used to create chloropleth map
visualizing the percent of minority populations per census tract for both
cities (Map 3). An additional
chloropleth map (Map 4) was produced to show the ratio of minorities to the
amount of white people per census tract,
Nm / Nw
where Nm is
the number of minorities per census tract and Nw is the number of
white people per census tract.
To
determine where a concentration of minority people live in the study area, the minority
population totals were submitted to a geostatistical hotspot analysis (Getis-Ord
Gi*) using ESRI’s spatial statistics package, an extension of their
ArcGIS software platform. This procedure
shows the concentration of a phenomena based upon the spatial relationships of
a related feature. In this case, a
chloropleth map was produced to show the concentration of minorities in the
study area (Map 5).
Upon
visual inspection of the hotspot analysis displayed in Map 5, it was then
determined that only Norfolk will be further examined for suitability, as the
greatest concentration of minorities occurs primarily within census tracts in
the city of Norfolk. Areas of Norfolk in
red shading in the western region of Map 5 were isolated into its own data
layer. Census tracts with a percentage
greater than 50% minorities within Norfolk were isolated into its own data
layer, as well. Average household income
information, acquired from the TIGER website, was then overlaid with the
Norfolk census tracts. Census tracts
whose average household income was at or below the poverty level of $22,113 was
isolated into its own data layer and is displayed in Map 6. A list of Norfolk public school addresses was
acquired from the Norfolk Public Schools website (2013) and then geocoded using
an address matching service built into ESRI’s ArcGIS software platform. To determine the 2-mile distance from these
schools, a service area analysis based upon the local street network was
performed via the network analyst extension in ArcGIS. The result was an output polygon layer
showing two mile distances from each school based upon accessible roads. The school distances layer, the poverty layer
(Map 6), the proportional minority layer, and the minority population concentration
layer were then merged into one output in the GIS.
A layer
showing the locations and addresses of the farm and garden locations was loaded
into the GIS, and a service area analysis of 2 miles was utilized. Since areas within 2 miles needed to be
excluded from the results, the ‘erase’ function in the GIS was used to omit
areas within 2 miles from an existing farm and garden. Finally, the results were compiled together
using overlay analysis in the GIS, producing an output showing areas (as a
shaded polygon) that meet all of the above criteria (Map 7). It should be noted that there was originally a
polygon near the northwest corner of Map 7, but it was manually removed since this
area is a militarized zone.
A
summary of the entire methodology workflow is presented in Figure 1.
Section III: Results
As shown
in Map 7, suitable areas for an additional biointensive farm plot were predominantly
in the northern and southeastern sections of Norfolk, as indicated by the shading. Also, the extreme southern stretches of the
city might be suitable. Areas not shaded
either did not meet the selection criteria, or were located outside of the
city.
The
percentage of racial minorities presented in Map 3 provided too vague a
distribution of minority populations, and was therefore omitted from the
analysis. It did however provide a
visual clue in isolating suitable areas to Norfolk, as the dark red polygons on
the map show where a higher number of minorities are located compared to the
total population of the study area (and most of the higher values were located
in Norfolk).
Section IV: Discussion and
Conclusion
The results presented in Map 7 are by no means intended
to be exhaustive in their area coverage.
Other factors, such as soil moisture, soil contamination, land cover,
land ownership, and other geographical criteria will need to be taken into
account.
The
analysis result itself was imperfect. The
shaded area of suitability in Map 7 also covers water bodies, roads, buildings,
and other sites incompatible with biointensive agriculture.
As such, there exists a
possibility for further research in determining site suitability. More detailed criteria, such as only
including sites that are abandoned lots, or where a specific plot of land is
known to be available, could help improve location determination. A more detailed spatial analysis such as
excluding unusable areas like as bodies of water, roads, buildings, and other
non-suitable areas could have provided a more detailed result than what was
presented in Map 7. Nevertheless, a
generalized overview of suitable sites for a new biointensive farm plot based
upon the above-mentioned criteria can assist The Micro Farms with their
location selection.
Section V: References
Grow
Pittsburgh. (2013 June 17). Why
grow food?. Retrieved from www.growpittsburgh.org/why-grow-food/
McKenzie-Mohr,
D., & Smith, W. (1999). Fostering
sustainable behavior: An introduction to community-based social marketing.
(pp. 71-81). Gabriola Island, BC: New Society Publishers.
Micro
Farms. (2013, June 28). Micro
farms. Retrieved from http://ecocycling.org/activities/projects/microfarms/whatwedo/
National Poverty Center, University of Michigan Gerald R.
Ford School of Public Policy. (2010). Poverty in the United States:
Frequently asked questions. Retrieved from
http://www.npc.umich.edu/poverty/
Norfolk Public Schools. (2013). All
schools list. Retrieved from http://www.nps.k12.va.us/index.php/nps-schools
Pearce,
J., Blakely, T., Witten, K., & Bartie, P. (2007). Neighborhood deprivation
and access to fast-food retailing. American
Journal of Preventive Medicine, 32(5),
375-382.
United
States Census Bureau. (2013, June 24). Tiger
products. Retrieved from http://www.census.gov/geo/maps-data/data/tiger.html
Warren, L.
(2003). American environmental
history. (1 ed., pp. 298-322). Malden: Blackwell.
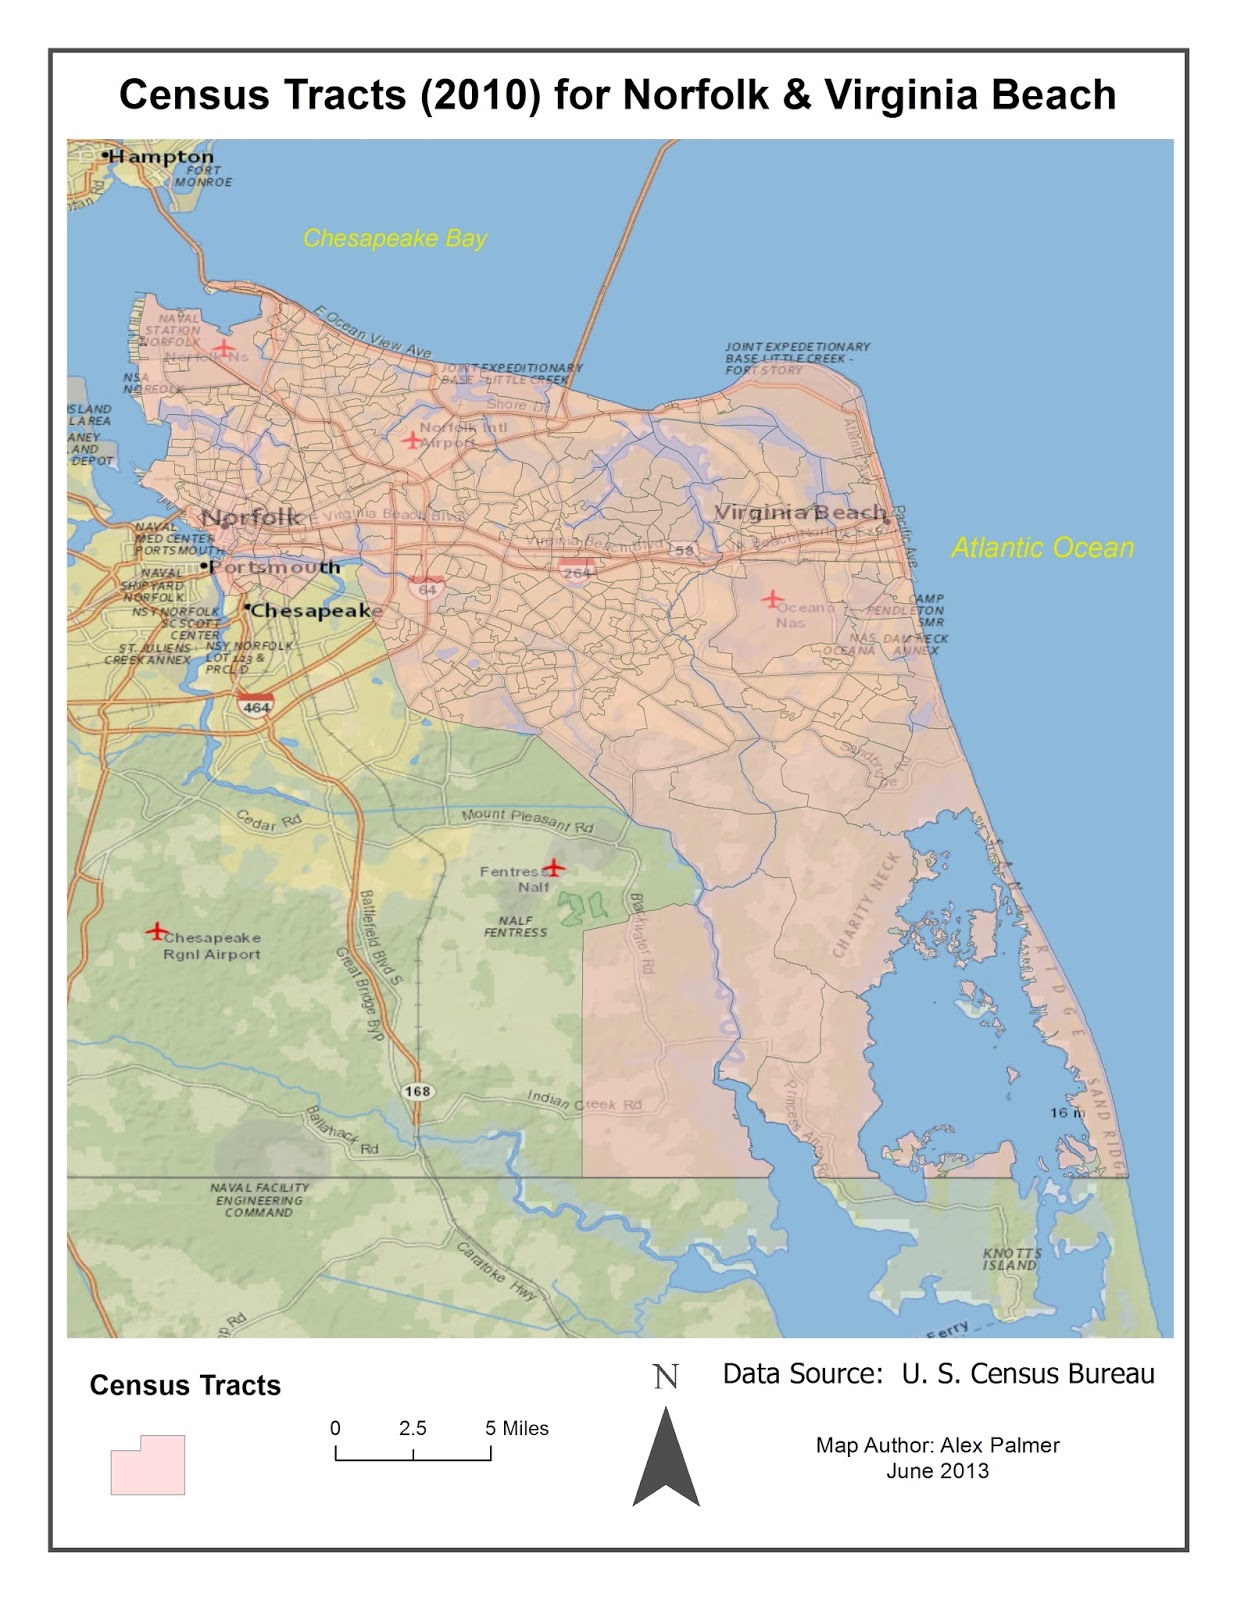 |
| Map 1: Study area. |
 |
Map 2: Current distribution of biointensive
farms
and community gardens in Norfolk and Virginia Beach.
 |
Map 3:
Percent of minority people versus total population per census block.
 |
Map 4:
Ratio of minorities to white people per census tract in Norfolk and
Virginia Beach.
 |
Map 5:
Concentration of minority people in Norfolk and Virginia Beach.
|
 |
Map 6: Census tracts in Norfolk at or below an average household income of $22,113.
|
 |
| Map 7: Analysis results |
 |
Figure 1: Methodological summary for a
suitability analysis for a location for a new biointensive farm plot in
Norfolk, Virginia. See text for
details. Click to enlarge.
|

Comments
Post a Comment